LiveCode is the premier environment for creating multi-platform solutions for all major operating systems - Windows, Mac OS X, Linux, the Web, Server environments and Mobile platforms. Brand new to LiveCode? Welcome!
Moderators: FourthWorld, heatherlaine, Klaus, kevinmiller, robinmiller
-
ace16vitamine
- Posts: 130
- Joined: Fri Apr 13, 2018 1:53 pm
Post
by ace16vitamine » Wed Aug 30, 2023 9:21 am
Hi all,
currently I am working with Lihe Graphs and I remember that I already found a solution for my problem years ago - But I forgot how I solved this.

Let me explain:
I have a simple Line Graph with some values by Day in the range between 50 and 100. The Problem: The LineGraph ist starting with 50 because this is the minimum value.
Example:
1,50
2,100
3,75
My goal is to set the minimum value shown to 0 and not to 50 in the graph, means that the line is not on the bottom of the LineGraph.
Any Ideas how to fix this?
Stefan
-
jmburnod
- VIP Livecode Opensource Backer

- Posts: 2718
- Joined: Sat Dec 22, 2007 5:35 pm
- Location: Genève
-
Contact:
Post
by jmburnod » Wed Aug 30, 2023 9:39 am
Hi,
what about this ?
0,0
1,50
2,100
3,75
Best regards
Jean-Marc
https://alternatic.ch
-
ace16vitamine
- Posts: 130
- Joined: Fri Apr 13, 2018 1:53 pm
Post
by ace16vitamine » Wed Aug 30, 2023 9:43 am
jmburnod wrote: ↑Wed Aug 30, 2023 9:39 am
what about this ?
0,0
1,50
2,100
3,75
Hey, Ive tried this also before.... But with 0.0 the first point in the graph is on 0 and this is wrong

-
dunbarx
- VIP Livecode Opensource Backer
- Posts: 9670
- Joined: Wed May 06, 2009 2:28 pm
- Location: New York, NY
Post
by dunbarx » Wed Aug 30, 2023 3:22 pm
Hi.
How are you generating the X and Y values? In other words, what is the story with the ordered pairs as you wrote them? I see no obvious arithmetic relationship, only that the first value is 50, the second is 100 and the third is 75.
This problem should be trivial, if we knew the method.
Craig
-
dunbarx
- VIP Livecode Opensource Backer
- Posts: 9670
- Joined: Wed May 06, 2009 2:28 pm
- Location: New York, NY
Post
by dunbarx » Wed Aug 30, 2023 3:24 pm
Rereading, is it that the first value is the day number, and the second is some value associated with that day?
OK, then what is the requirement for loading that second value? In other words, is that value simply entered, or is there some method to generate that value?
Craig
-
dunbarx
- VIP Livecode Opensource Backer
- Posts: 9670
- Joined: Wed May 06, 2009 2:28 pm
- Location: New York, NY
Post
by dunbarx » Wed Aug 30, 2023 3:27 pm
Rereading yet again,
My goal is to set the minimum value shown to 0 and not to 50 in the graph, means that the line is not on the bottom of the LineGraph.
But if you want the minimum value to be 0, then doesn't the "line" NEED to be on the "bottom"
Craig
-
dunbarx
- VIP Livecode Opensource Backer
- Posts: 9670
- Joined: Wed May 06, 2009 2:28 pm
- Location: New York, NY
Post
by dunbarx » Wed Aug 30, 2023 3:28 pm
I feel like I am mimicking Richmond's posting style.

Craig
-
dunbarx
- VIP Livecode Opensource Backer
- Posts: 9670
- Joined: Wed May 06, 2009 2:28 pm
- Location: New York, NY
Post
by dunbarx » Wed Aug 30, 2023 3:34 pm
May as well keep going with this.
It sounds as if you would be better served with a bar graph instead of a line graph. A bar graph shows values associated with some arbitrary parameter, such as a day number and the temperature that day.
A line graph usually shows a relationship between two variables, known as an "independent variable" and a "dependent variable", and shows the "trend" as the independent variable changes. For example a series of numbers and their squares.
You can force either to do the job, but this goes back to the original question, what are you trying to display?
Craig
-
ace16vitamine
- Posts: 130
- Joined: Fri Apr 13, 2018 1:53 pm
Post
by ace16vitamine » Wed Aug 30, 2023 5:21 pm
Hi Craig,
we are analyzing blood test results and want to show the trend.
Means:
Test 1: Result = 50
Test 2: Result = 100
Test 3: Result = 75
This is for what I am looking for. You can see that the graph is starting with 0 in this example I found:
And this is what I have. You can see that the graph ist starting with the lowest value.
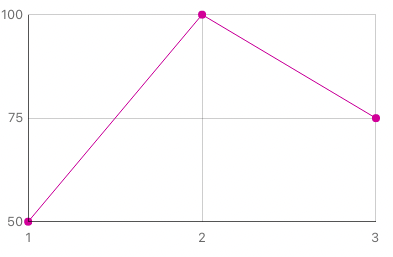
- not this.png (33.13 KiB) Viewed 13029 times
-
dunbarx
- VIP Livecode Opensource Backer
- Posts: 9670
- Joined: Wed May 06, 2009 2:28 pm
- Location: New York, NY
Post
by dunbarx » Wed Aug 30, 2023 6:22 pm
Aha.
I did not get the fact that your "50" was sitting on the abscissa.
You must currently use item 2 of the loc of the point you want to place that small "X" graphic, or some other means of setting the vertical location of that point. And you use that point to then draw the line graph.
I do not know your code, but isn't there a single line in it where you might (pseudo):
Code: Select all
subtractSomeConstantFromTheCurrentVerticalValueOfYourTestResult
before plotting that point?
That "constant" would be the vertical difference between the abscissa and the "50" on your graph.
Craig
-
dunbarx
- VIP Livecode Opensource Backer
- Posts: 9670
- Joined: Wed May 06, 2009 2:28 pm
- Location: New York, NY
Post
by dunbarx » Wed Aug 30, 2023 6:27 pm
I do a lot of rereading of your posts and have to come back. I apologize, though it does help keep me ahead of Richmond in the post race.

The most recent graph shows the "75" to be lower than the "50". This is assuming that the three test values are still '50,100,75". Was that just an example of how the graph works, and not some other plotting factor I do not know about?
Craig
-
ace16vitamine
- Posts: 130
- Joined: Fri Apr 13, 2018 1:53 pm
Post
by ace16vitamine » Wed Aug 30, 2023 6:45 pm
Hey,
I am talking only about "How the LG looks like".
In my example the LG Y is starting @0 and ending@700, it doest care about the values because it is fixed formatted.
In my LiveCode Example the Start and the End is dynamically calculated.
I want a Line Graph where the Y Start and End is preformatted and not dynamically calculated from the values
-
bn
- VIP Livecode Opensource Backer
- Posts: 4003
- Joined: Sun Jan 07, 2007 9:12 pm
- Location: Bochum, Germany
Post
by bn » Wed Aug 30, 2023 6:55 pm
Hi Stefan,
would this help?
You could change the color of the one point at 0,0 so it does not show much.
Kind regards
Bernd
-
ace16vitamine
- Posts: 130
- Joined: Fri Apr 13, 2018 1:53 pm
Post
by ace16vitamine » Wed Aug 30, 2023 7:10 pm
Hi Bernd from Bochum,
(I remember you helped me some yrs ago with another LineGraph issue
).
Yes, this would help. Not beautiful but enough.
Thank you you guys and have an nice evening.
Stefan
-
dunbarx
- VIP Livecode Opensource Backer
- Posts: 9670
- Joined: Wed May 06, 2009 2:28 pm
- Location: New York, NY
Post
by dunbarx » Wed Aug 30, 2023 7:14 pm
I want a Line Graph where the Y Start and End is preformatted and not dynamically calculated from the values
I do not understand.
If you get a series of test results, however you "label" each of them them, how do you intend to locate the points on the graph? By hand? It is simple to create a gadget that does this for you. so that all you need do is enter the test values, and the graph pops up, complete. I believe, from a previous post, that this is exactly what you wish for.
If you want I will make it for you. For me this is just for fun.
Craig